Data Center Interconnect (DCI) carries traffic between data centres over coherent optical links. This project assembles the patent record behind that technology, places every application on the DCI value chain, reconstructs how the field cites itself, and then asks the economic question: does holding a position on this chain translate into national advantage in AI science and AI technology? Everything needed to reproduce the result — data, code, queries, report and paper — is published here.
What the corpus contains
The corpus is assembled from five retrieval routes and then graded, not filtered. Classification codes, being the 53 IPC and CPC items of the reference framework; 150 keywords matched with word boundaries; a curated applicant dictionary of 943 entities; the citation neighbours of everything retrieved; and targeted recollection of the queries that hit the export limit. The routes are merged, deduplicated at three levels — application, DOCDB family and organisation — and every record keeps its provenance, so any route can be switched off and the analysis rerun.
Grading replaces deletion. Evidence from the classification, keyword and firm routes is combined into four tiers, and the tier is a column rather than a filter, which makes the sensitivity of every result to the DCI definition checkable.
| Tier | Applications | Share | Meaning |
|---|---|---|---|
| Core | 566,053 | 54.8% | DCI in the narrow, physical-layer sense |
| Related | 94,987 | 9.2% | adjacent evidence, one route only |
| Peripheral | 360,191 | 34.9% | broad or generic matches |
| Excluded | 11,999 | 1.2% | flagged false positives, retained for audit |
| Master | 1,033,230 | 100% | analysis-ready single table |
Grading shifts the country composition in a way that validates the definition. The United States falls from 48.2% of the full master to 39.8% of the core tier, while Japan rises from 14.3 to 17.3%, China from 7.3 to 10.3% and Korea from 7.0 to 9.0%. Software-adjacent broad filings drop to the peripheral tier and optical component and module filings remain, which is what a physical-layer definition of DCI should do.
Where the patents are
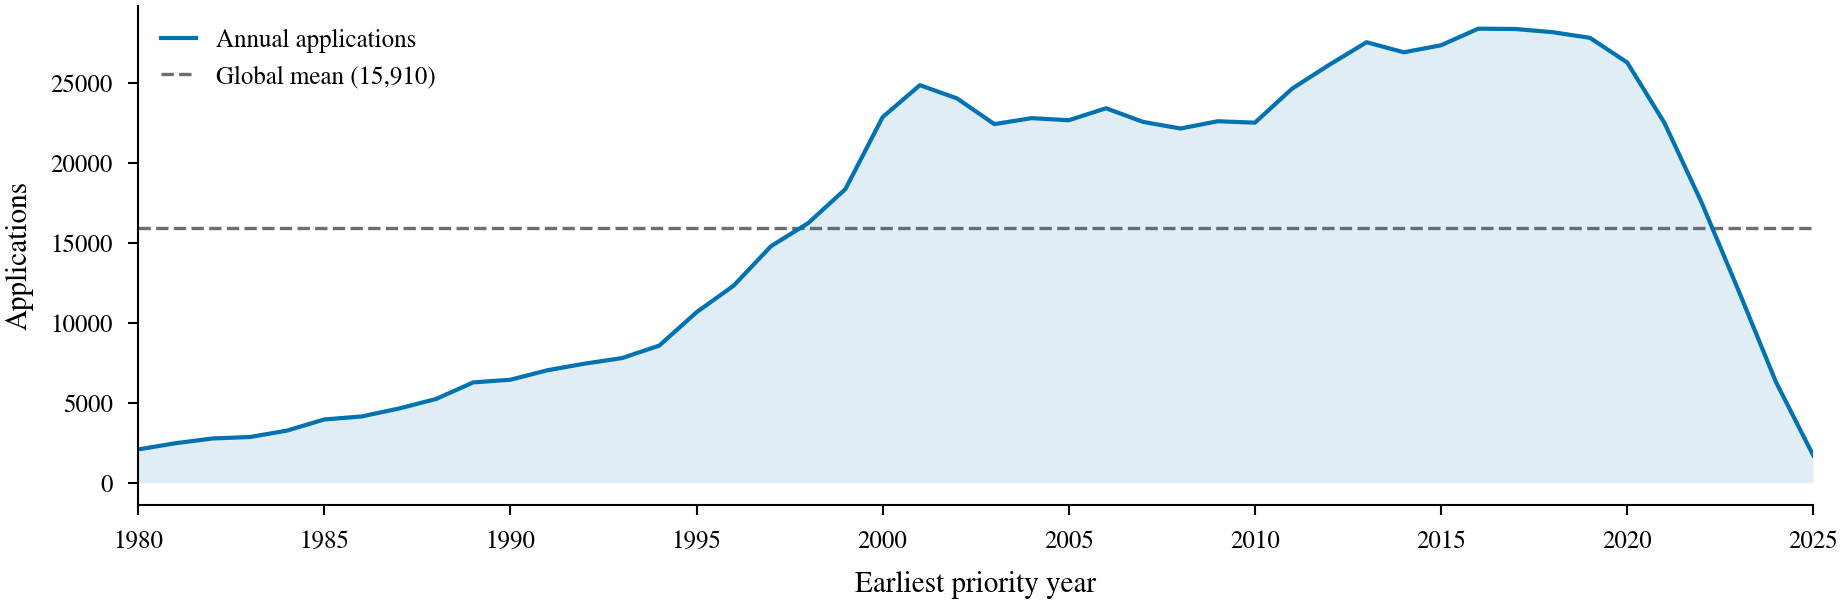
The United States holds 316,255 applications by applicant country, ahead of Japan, China and Korea. The gap between filings at the Chinese office (283,568) and applications with a Chinese applicant country (48,227) reflects both domestic filing behaviour and the weaker country coverage of Chinese person records. Country attribution is not missing at random, so country-level results are checked against the complete-country subsample.
| Applicant country | Applications | Patent office | Applications |
|---|---|---|---|
| United States | 316,255 | US | 434,862 |
| Japan | 91,762 | CN | 283,568 |
| China | 48,227 | JP | 109,924 |
| Korea | 45,031 | WO | 70,387 |
| Germany | 28,259 | EP | 48,303 |
| Total (157 countries) | — | Total (86 offices) | 1,033,230 |
Position on the value chain
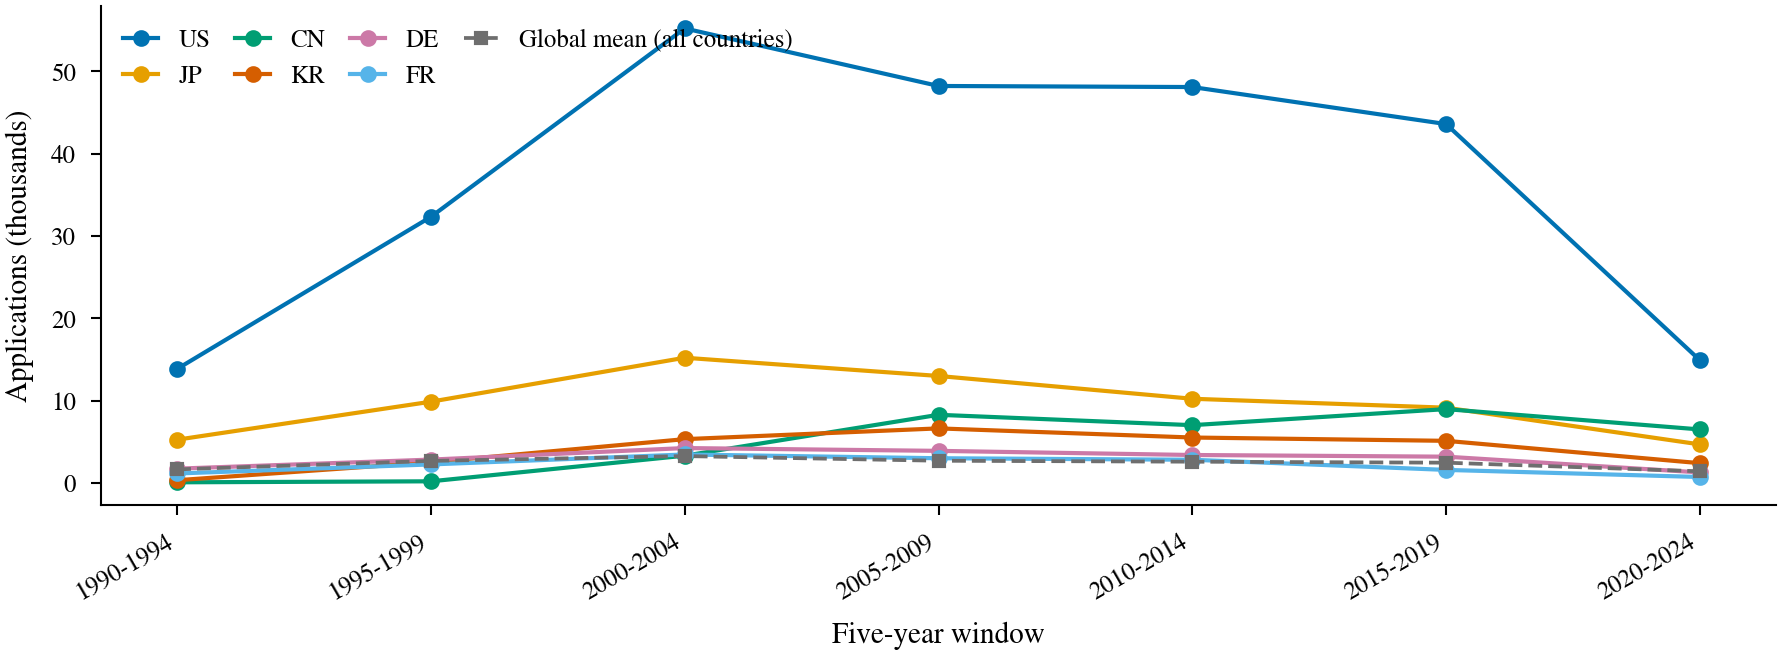
Each application is placed on the DCI value chain by two independent routes. Classification codes decide position from the technology recorded in IPC and CPC; the applicant dictionary decides position from the filer's known place in the industry. Membership is multiple and the two routes overlap, so totals are unions rather than sums. Adjacent technologies, previously folded into the six production positions, are now carried as a seventh position of their own.
| Position | Classification | Applicant | Both | Union |
|---|---|---|---|---|
| S0 Materials and substrate | 61,115 | 29,286 | 8,111 | 82,290 |
| S1 Design and architecture | 0 | 104,309 | 0 | 104,309 |
| S2 Optical core components | 184,833 | 185,462 | 61,714 | 308,581 |
| S3 Module assembly | 104,561 | 110,271 | 22,206 | 192,626 |
| S4 Advanced packaging (CPO, SiPh) | 119,892 | 54,344 | 11,793 | 162,443 |
| S5 Systems, submarine, operations | 265,149 | 258,493 | 112,292 | 411,350 |
| ADJ Adjacent technologies | 44,011 | 233,911 | 8,466 | 182,042 |
| Unique applications in scope | 758,654 |
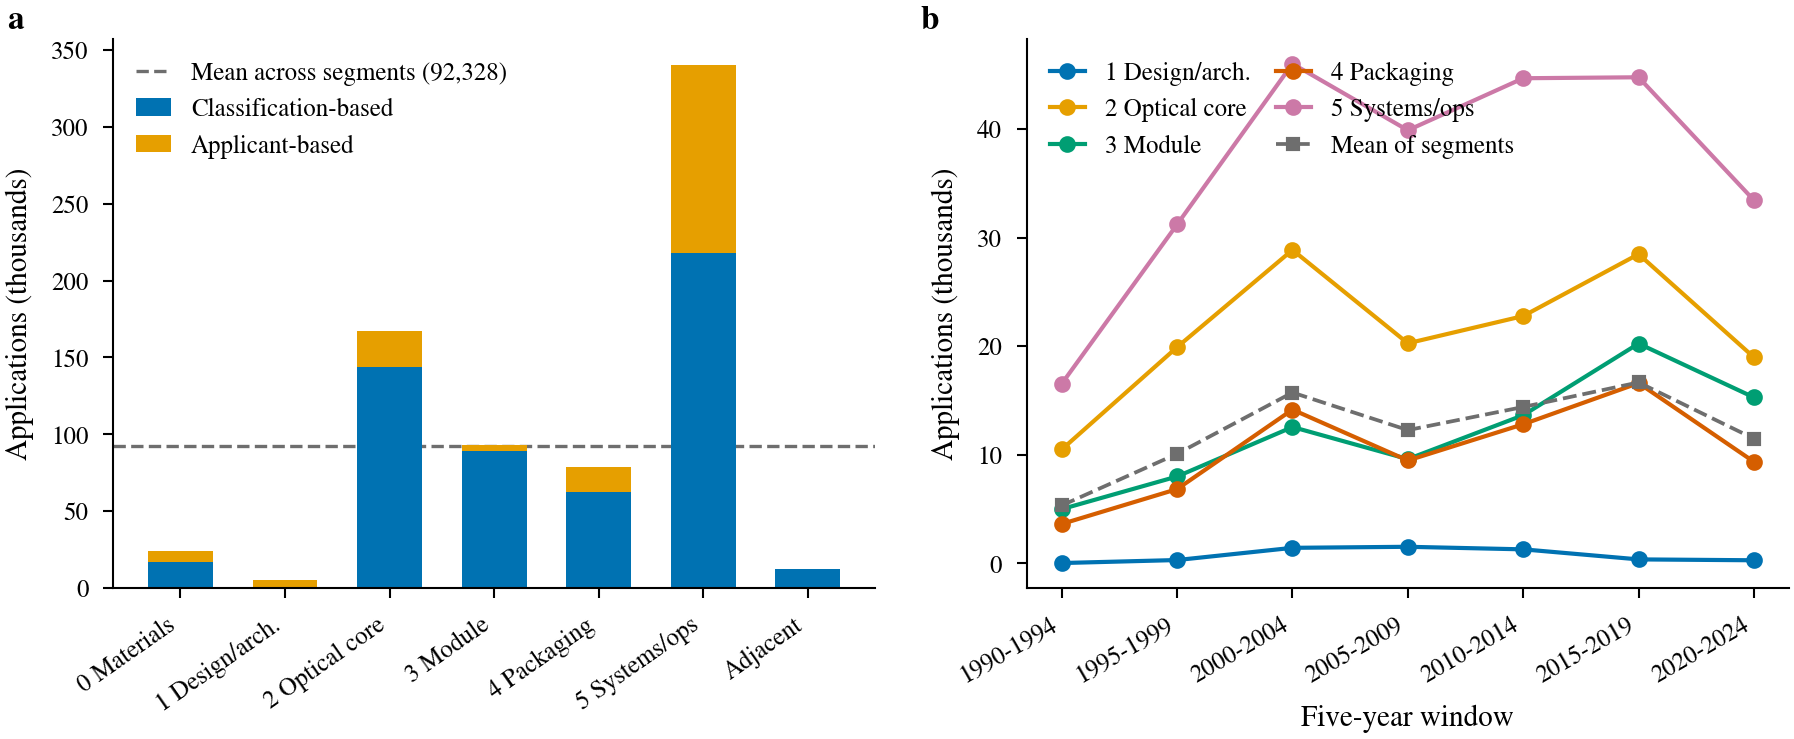
Firm concentration within a position is pronounced and consistent with the industry: two or three firms hold a large share of each position's patents. Consolidating acquisition lineages matters for reading these ranks. Corning's seven filing entities amount to 6,077 applications where the largest single entity alone shows 3,163, and the published firm table folds Coherent (II-VI, Finisar), Lumentum (Oclaro, NeoPhotonics, JDSU), Nokia (Infinera, Coriant, Alcatel-Lucent), Marvell (Inphi, Celestial AI), Cisco (Acacia), Broadcom (Avago) and NVIDIA (Mellanox) in the same way.
The upstream is almost invisible
Linking the trade codes of the reference framework to the corpus through their classification codes exposes a sharp asymmetry. The two transceiver headings stand on large patent stocks, while the materials chokepoint that dominates supply-chain discussion barely registers: gallium, germanium and indium link to 136 applications, doped wafers to 1,557. Control over these inputs is exercised through capacity and export licensing, not through patents, which is precisely why patent data alone cannot see it.
| HS heading | Traded good | Linked applications |
|---|---|---|
8517.62 | Transmission and switching equipment | 118,075 |
8517.79 | Parts of 8517 apparatus | 97,453 |
8541.49 | Laser diodes, photodiodes, APDs | 35,983 |
9001.10 | Optical fibres and bundles | 23,276 |
8542.31 | Processors and controllers | 15,135 |
3818.00 | Doped wafers (InP, GaAs) | 1,557 |
8112.92 | Gallium, germanium, indium | 136 |
How the field cites itself
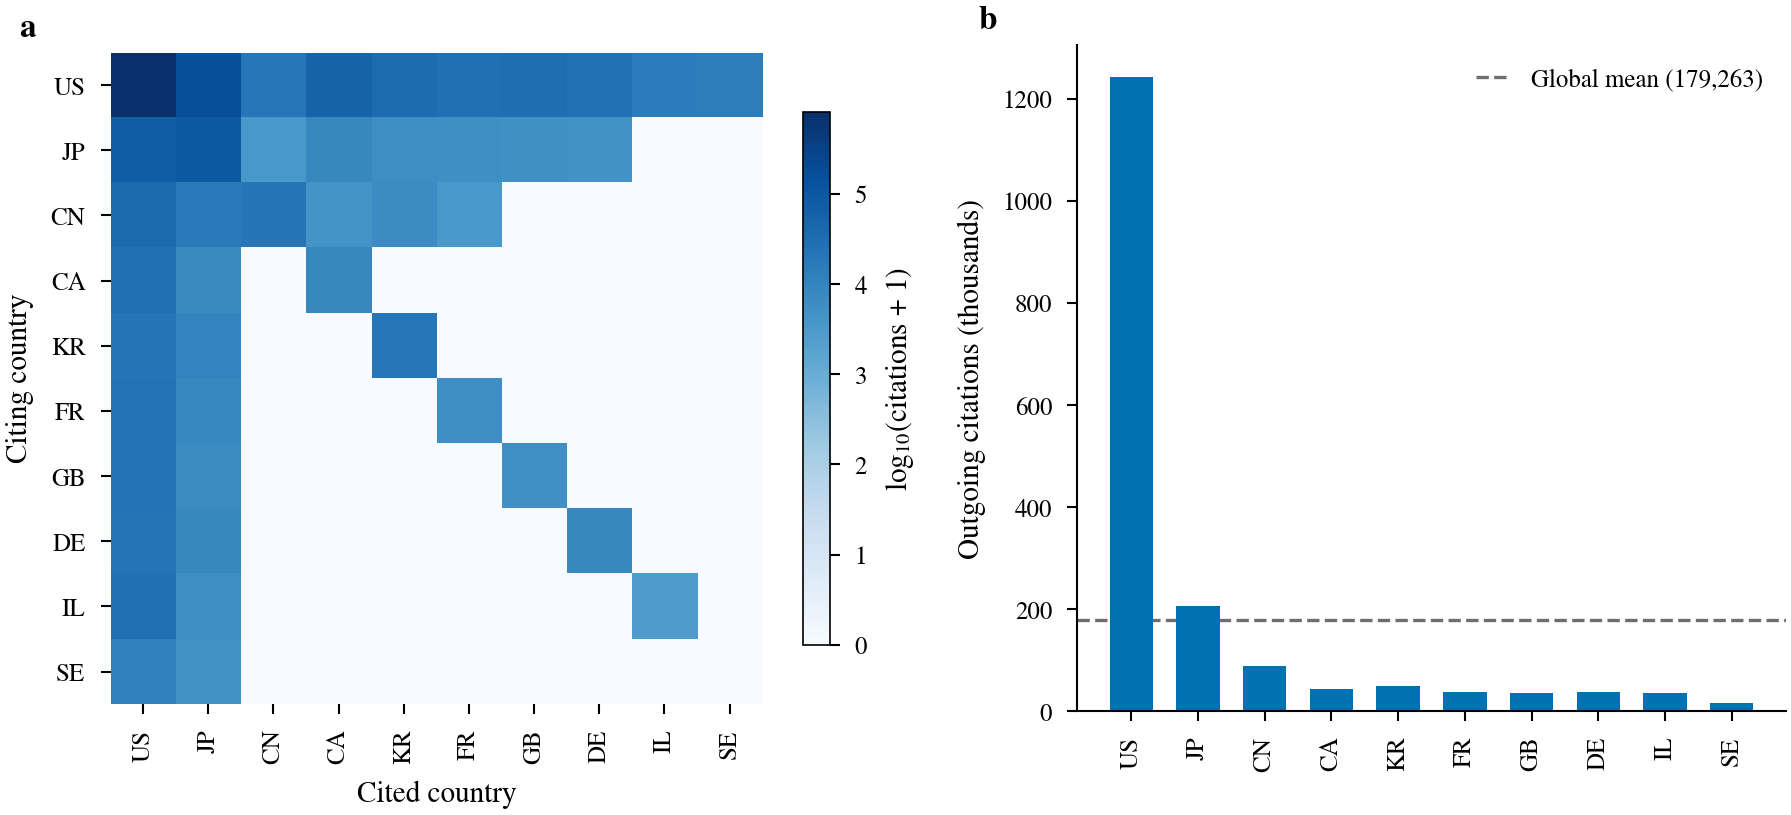
The citation layer resolves 2,188,730 directed edges over 927,481 applications across 2,358 country pairs, on a unique-pair basis. Read as knowledge flow, the asymmetries are sharp. The United States is the largest node on both sides, but 709,708 of its citations are American applications citing American applications; setting self-citations aside changes the picture. On cross-border edges Japan is the largest net provider of cited knowledge at +98,437, followed by Canada at +29,762 and Korea at +11,976, while the United States is the largest net absorber at −90,096 and China the second at −38,873. The two deficits are of different kinds. The American one arises because the corpus is dense in American filings that draw on Japanese component patents; the Chinese one arises from a thin stock of cited Chinese filings against heavy citing of American ones, 31,485 citations in that direction alone, which is the signature of a follower position in the optical layer.
Projected onto the value chain, the direction of flow confirms the chain. Optical components and module assembly feed upward into systems, and systems is where knowledge accumulates, with 371,872 internal citations, the largest single cell of the matrix. Advanced packaging is small in volume but connects in both directions to materials, components, modules and systems, which is the junction the industry expects co-packaged optics to become.
What the capability buys: the national panel
The corpus is the input to a second question. Does a position on the DCI chain convert into national advantage in AI? The panel joins three sources at country by field by year: DCI patents from this corpus, AI science from 2,701,689 Web of Science papers across 253 fields with fractional counting, and AI technology from 2,330,553 AI patents across 15 canonical fields. The 44,651 applications that appear in both the DCI and the AI patent masters are removed from the outcome, so no application sits on both sides of an equation.
Revealed comparative advantage is Balassa's index; relatedness follows the proximity-and-density construction of the economic-complexity literature; the DCI side enters as a cross density, the projection of a country's value-chain holdings onto the field space. Three margins are estimated separately with country, field and year fixed effects and country-clustered errors, at lags of one, three and five years: entry, meaning gaining advantage; sustain, meaning keeping it; and exit, meaning losing it.
- Technology entry: direct transfer. DCI cross density raises the probability of entering an adjacent AI patent field on its own, by +0.025 per standard deviation at lag one and +0.037 at lag five, and the interaction with the country's existing technological base adds a further +0.023 (p<0.01).
- Science entry: conditional. The same capability on its own does not secure comparative advantage in a new AI science field; the apparent main effect is a proxy for the scientific base. Only the interaction with that base is significant, at +0.016 (p<0.01) at lag one. Crossing between knowledge spaces requires a bridge.
- Sustain and exit: capability alone suffices. Keeping a scientific advantage is explained by DCI proximity itself, +0.028 at lag three (p<0.01), with no amplification from the science base, and exit is its mirror image.
- Which position. Estimated position by position, advanced packaging (S4) is the only one significant on both margins, at +0.020 on technology entry and +0.021 on science sustain.
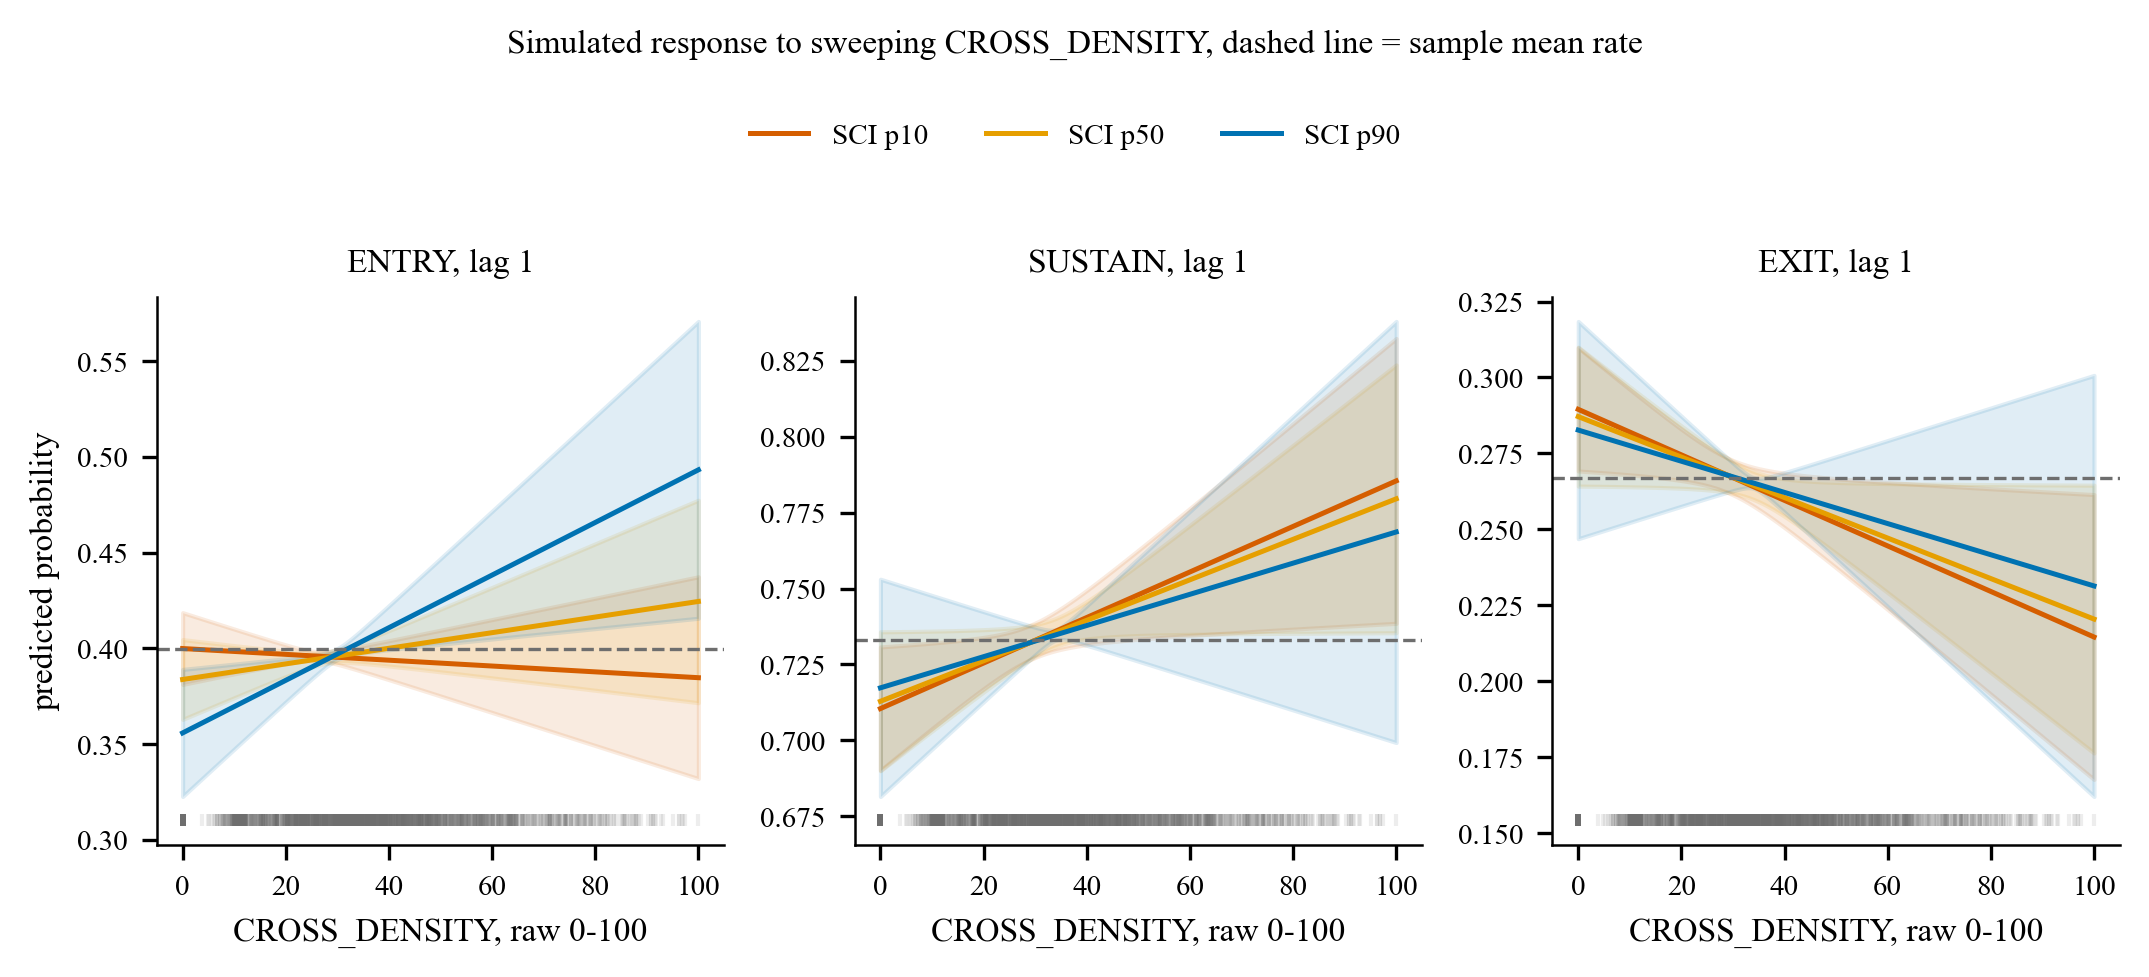
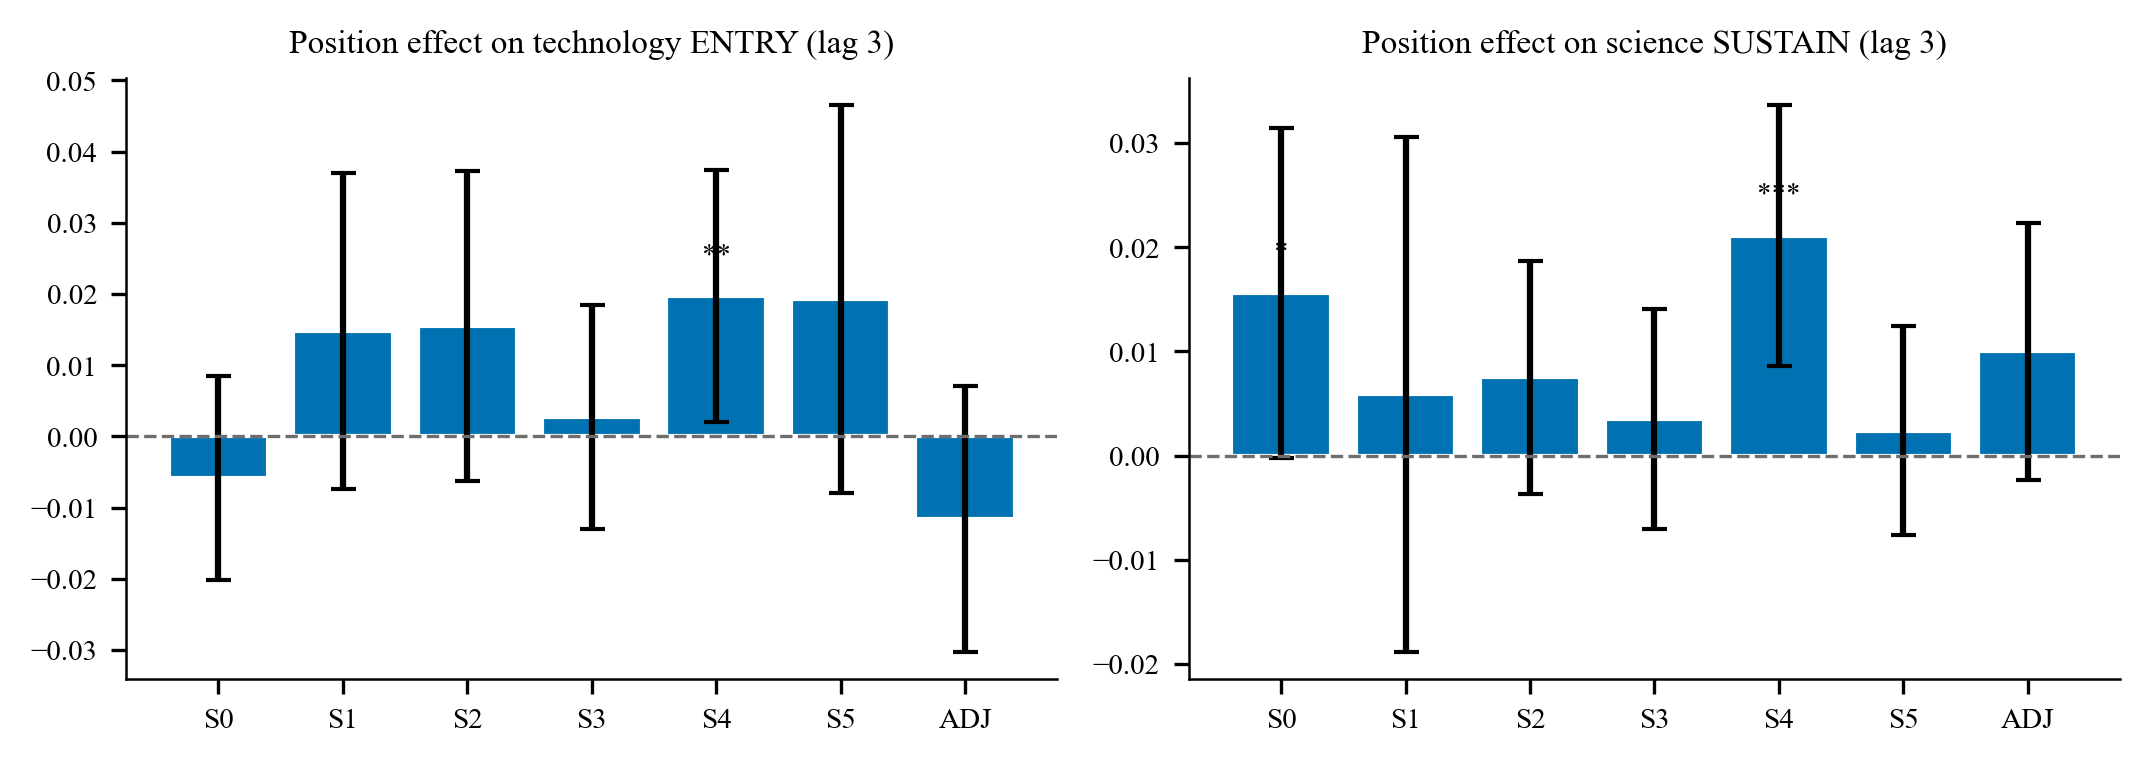
The effects appear with a lag of one to five years, which turns the vulnerability logic of the interdependence literature into an investment timetable: capability bought after a bottleneck has already bitten arrives late by exactly that lag. Method, full tables and figures are in the panel paper, and the specification search behind them, 1,005 specifications, is published so that the exploratory-then-confirmatory sequence is visible.
Reproducing this
The published dataset is the output of collection and grading; every figure and table above is regenerated by the notebooks from those files.
git clone https://github.com/deep1003/dci-patent-atlas.git
cd dci-patent-atlas
pip install -r requirements.txt
jupyter lab notebooks/dci_patent_atlas_analysis.ipynb        # corpus, value chain, citations
jupyter lab notebooks/dci_science_relatedness_panel.ipynb    # RCA panel, regressions, figures
The notebooks are organised as tasks with steps underneath, one operation per cell. Collection from PATSTAT is documented rather than executed, since it needs credentials; the SQL and the collector are published in sql/ and scripts/. A note on method: retrieving all fields in one statement is refused by the PATSTAT cost estimator under the 2026 Spring edition, and a reduced variant returns two records in 352 seconds. Splitting the retrieval into four set-based statements joined locally returns 850 applications in 0.87 seconds.
Contents
data/— graded master (1,033,230 applications), citation edges and nodes, country flows, panel tables (RCA, proximity, controls), reference workbooknotebooks/— corpus notebook and panel notebook, both executed end to endscripts/— collector, integration, dedupe and grading, panel construction and estimationsql/— the four set-based PATSTAT statementstables/,figures/— published aggregates and figuresreport/— technical report with full appendicespaper/— panel paper with appendices A to F (search strings, SQL, keyword rules, code)